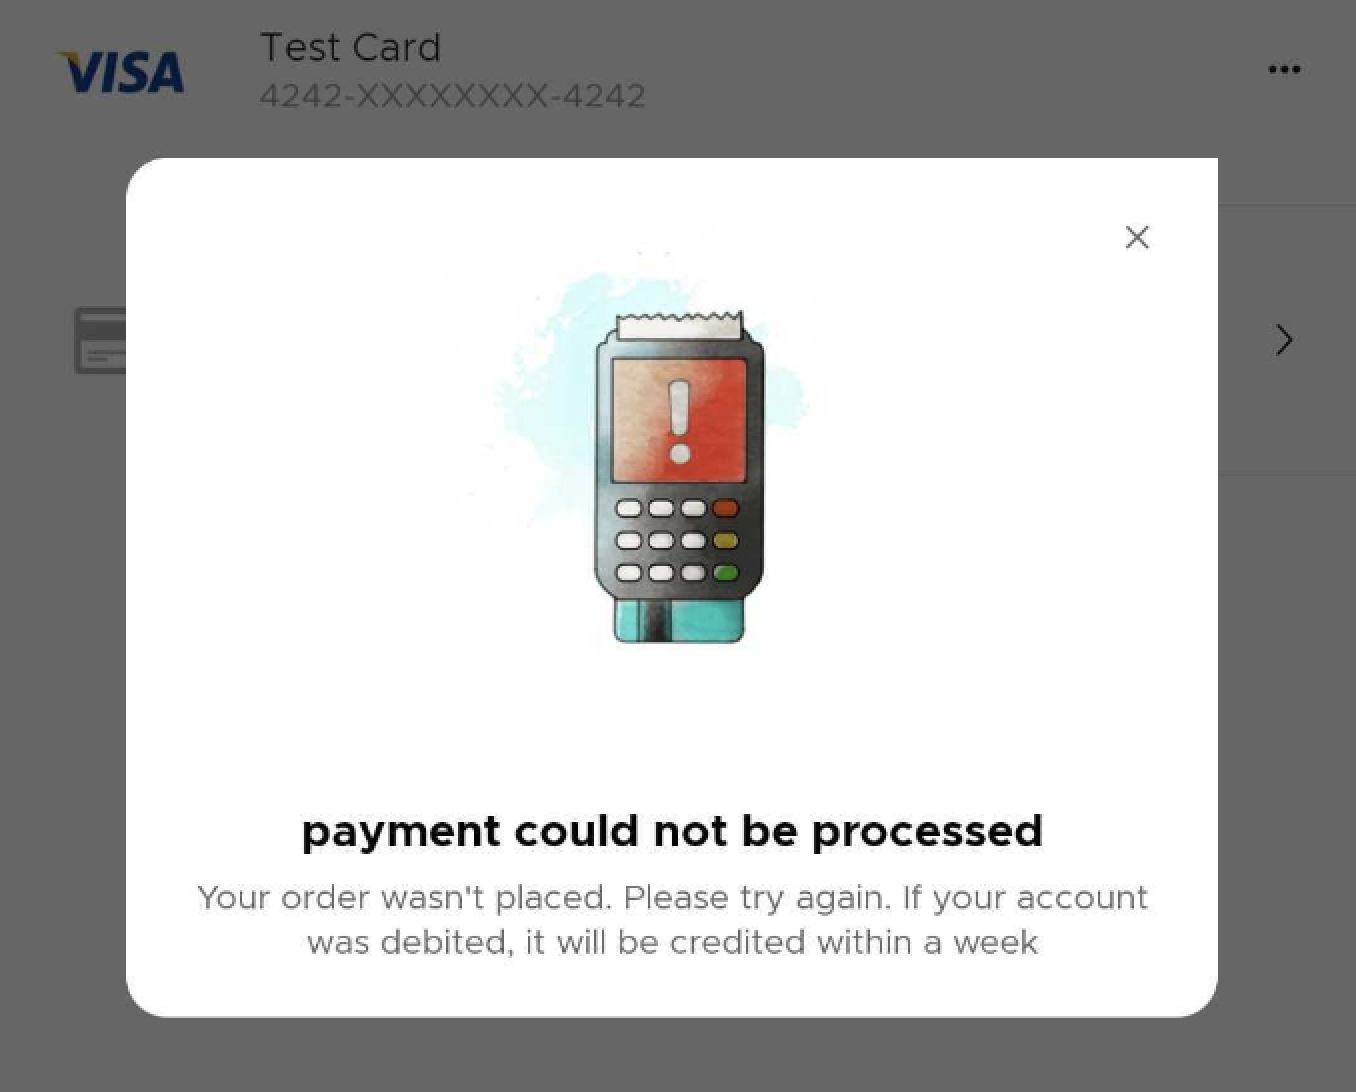
Anyone who has ever been associated with a high pace business understands the importance of metrics in its success and growth. And Transaction Success Rate is one of the most critical metrics to monitor as you would obviously want to track how well your business is getting paid!
We stumbled upon this problem since we did not have a success rate monitoring solution and consequently no alerting if any of the payment instruments started failing. We needed an in-house monitoring setup to take remedial measures and prevent customers from using a payment instrument that is currently experiencing problems.
What is Transaction Success Rate?
Transaction Success Rate (TSR) is defined as the ratio of successful transactions to the total number of attempted transactions. For example, if we initiated 100 transactions and 95 of them were successful, our success rate would be 0.95 or 95%.
Why is it important to monitor?
Since all payments for almost any merchant are virtually dependent on an external entity such as a payment gateway, issuer bank etc., they are bound to fail at some point, thanks to Murphy’s law.
Suppose the success rate of any payment instrument falls below a certain threshold. In that case, ideally, that instrument should be disabled, or the customer should be discouraged from using that instrument to prevent further transaction failures and consequently avoid a bad customer experience.
Most external gateways offer some form of a dashboard to monitor the state of individual transactions as well as the overall success rate. However, they usually do not provide any kind of alerting for the merchant, certainly not customizable ones. We needed to create an in-house monitoring and alerting system to take remedial steps proactively.
Background
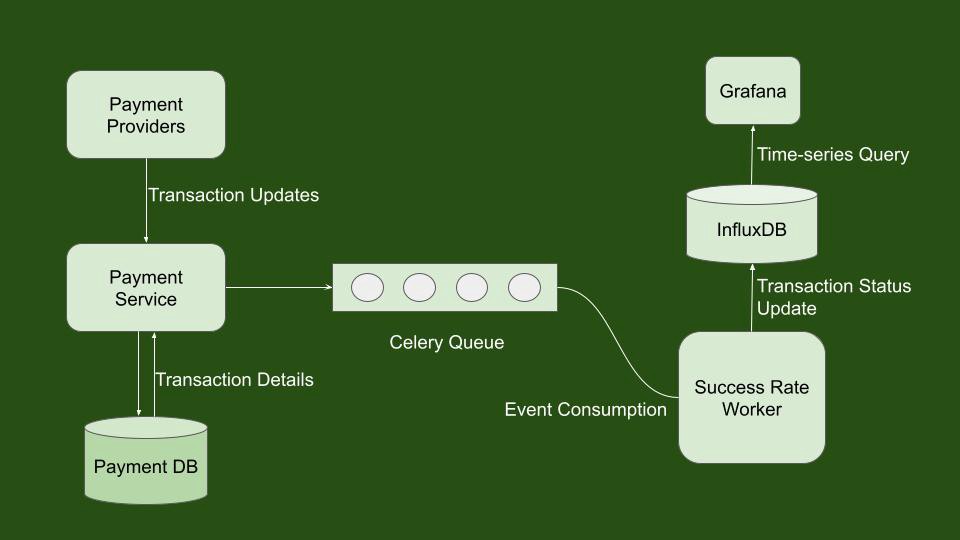
We currently use various payment providers to route transactions for different payment methods. Each payment provider responds with a status in the transaction initiation API call or using a webhook trigger. This status is the source of truth for the latest status of the initiated transaction. We needed to track the latest status of each transaction and aggregate this information over time.
We also needed to store this information in a datastore and query it based on attributes such as a particular payment method or payment gateway to get the success rate of those individual entities. As you might have noticed, this clearly gives rise to time-series data; hence we would need a Time Series Database (TSDB) to store this information and query this data efficiently.
We considered using Prometheus as the datastore since we already used it for other time-series data on production. But the problem is that we get multiple status updates from payment providers against each transaction as it progresses over time. And we wanted to maintain the latest status for each transaction and aggregate this data over time. Since it would not have been possible to maintain the status against unique transactions with Prometheus, we had to look for some other solution. Furthermore, we would also want to maintain attributes associated with each transaction, such as card issuer, payer VPA, etc.
So we wanted a relational data structure where we could maintain the uniqueness of each transaction despite multiple status updates. We would also want the transaction status to update in real-time as we get it from the payment providers. But we wanted this relational data structure to store this information and query it back efficiently based on timestamps.
Using InfluxDB as datastore
After some research, we decided to go with InfluxDB as our datastore because:
- InfluxDB is purpose-built for time series data, optimized for common time-series workloads.
- InfluxDB has a data structure that is similar to relational databases
- It supports very high write throughput (internally benchmarked to 100000 entries inserted in 4.189 seconds average)
- We were already using InfluxDB to store certain kinds of time-series data, so we had some in-house experience of running it on production
How does it all come together then?
At every status update, we insert a point into a measurement in InfluxDB. We use the transaction initiation time as the timestamp for this record. Each record also has a tagset that contains only one field i.e., a transaction ID to uniquely identify each transaction. InfluxDB identifies points(entries) uniquely by measurement name, tags and timestamps. So for this measurement, every time we do an insert operation for a transaction, it behaves as an upsert operation (status and metadata get updated). Pushing entries to InfluxDB is done via influxdb-python-client asynchronously by a celery task worker. Finally, older data gets flushed out by a retention policy that we put in place.
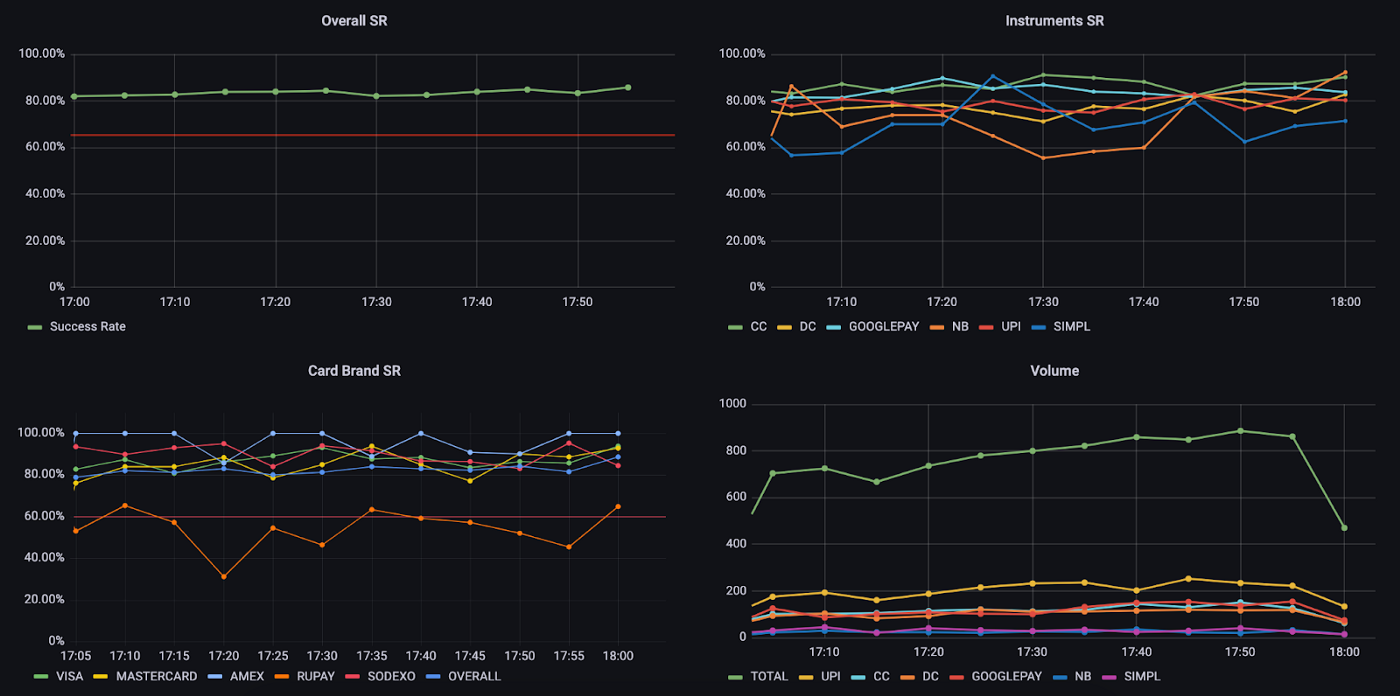
Alerting and Monitoring are set up using Grafana alerts which trigger Slack notifications when certain conditions are met. Over time, we have learned that in order to filter out false positives during low traffic or temporary drops by keeping the time window not too wide nor too narrow. Most of our payment methods trigger an alert when Success Rate averaged over 15 minutes drops below a certain threshold, which is again decided by considering their average Success Rate levels over a large window.
Currently, we’re running InfluxDB on a standalone c5.2xlarge EC2 machine with 10GB storage. With a peak load of ~300 transactions per minute and a hundred complex queries running in the background, we exhaust about 45% memory and 30% CPU on average.
Limitations
Due to the way InfluxDB works internally, it is very resource-intensive, especially on memory. Even if we use TSI and other optimizations, we would hit a point in the future where InfluxDB would not scale further. Furthermore, InfluxDB supports data sharding on multiple nodes only in the enterprise version, so on the data front as well, we would encounter a bottleneck at some point. Also, despite the fact that we were already using InfluxDB on production, we feel a lack of overall expertise required for maintaining it in the long run.
Future Scope
As discussed above, if we were to improve and iterate on this solution, we would want a setup that offers virtually unlimited scalability or at least scales well for all practical purposes for our use case. There are some attractive alternatives that we are looking forward to. One of them being TimescaleDB. Being built on top of Postgres, it offers a lot of confidence about maintaining it in the long run as well as overall robustness. It offers almost all the features that InfluxDB has to offer along with multi-node data sharding available in the open-source version.
Another one is Apache Flink. We could decide to go a different way with the design altogether and compute these aggregations over a data stream. This would help us in a couple of other use cases here at Blinkit and could in fact be used as a centralized infrastructure by many different teams to solve similar problems.