Make your reports faster: A beginner’s guide to Tableau Optimisation
In today’s world, given the pace at which data operates, we need a tool that can help us to generate reports faster and bring out insights within milliseconds. In order to solve this challenge, several companies have started utilising a few Business Intelligence (BI) tools such as Tableau/Power BI/Superset/Looker/Qlikview, etc. We at Blinkit have also moved away from the traditional way of reporting via spreadsheets to a more scalable and robust tool — Tableau.
Earlier, we had no single source of truthfor metrics; it took a significant amount of manual effort to compile data in spreadsheets, and we were frequently limited by our local memory.
Theoretically, Tableau can handle data up to ∞ rows and columns. However, it slowly begins to slow down as it renders calculations, fields, and formulas. At Blinkit, tracking supply and consumer metrics in real-time is the need of the hour. The faster we track, the faster we decide and move forward.
Given below are some hacks that enabled us to achieve a significant improvement in the performance of our dashboards. The effects have been noted across various aspects of our operations, including but not limited to:
Reduction in the average render/load time by over 50% in the last six months.
Over a three-fold improvement in throughput in traffic to views in the last three months.
A 50% reduction in the extract time over the last six months.
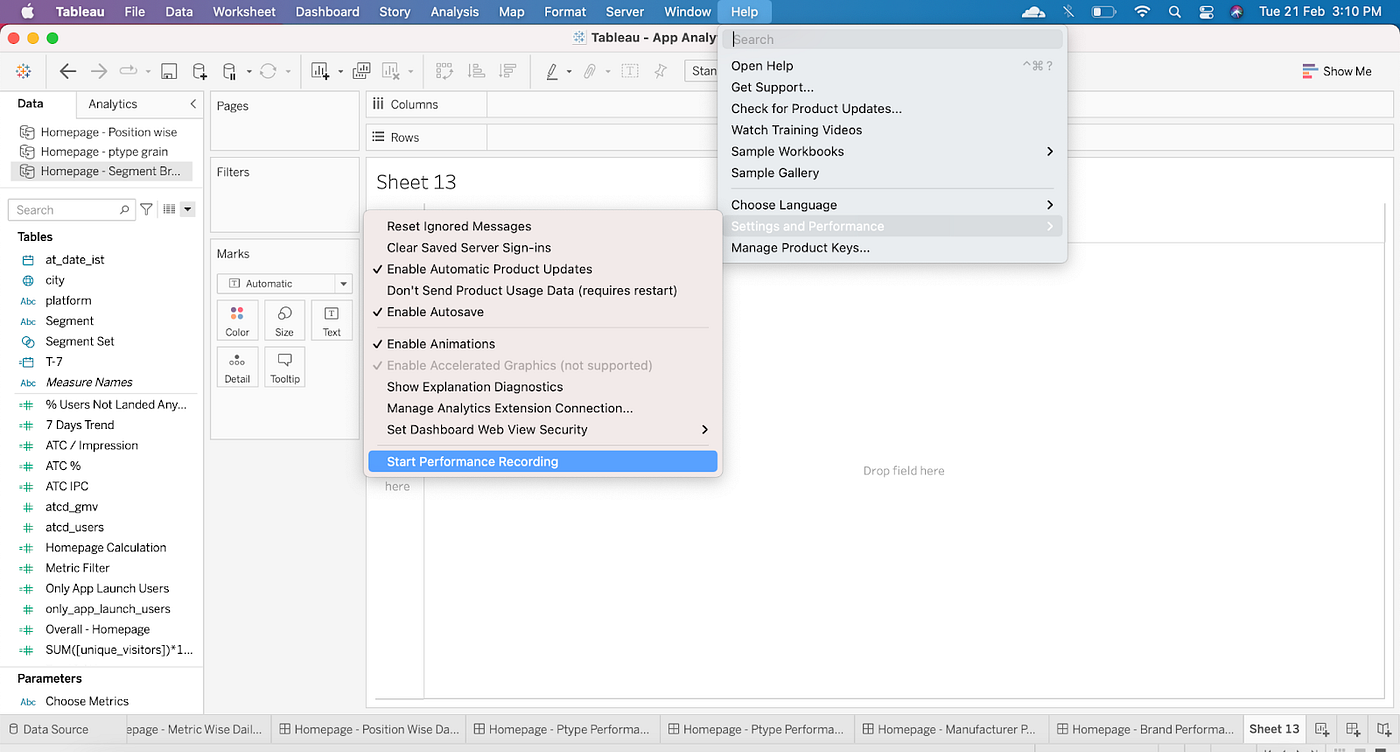
Check performance recording
This is the first step in identifying the problem. The performance recording gives information about key events as you interact with a workbook. Further details can be found here.
Fig. 1: Start Performance Recording in Tableau
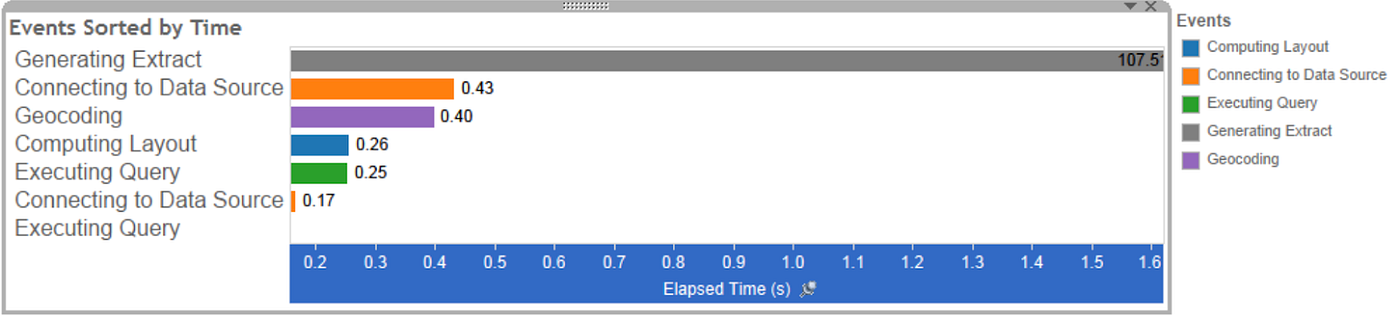
Fig. 2: Events Sorted by Time
Generating extract
To speed up extract generation, consider importing only some data from the original data source by using filters or importing a limited sample of data.
Connecting to data sources
Slow connections could be due to network issues or issues with the database server.
Executing Queries
For live connections, if queries are taking too long, it could be because the underlying data structure isn’t optimised for Tableau. Consult your Database server’s documentation. As an alternative, also consider using extracts as opposed to live connections.
For extracts, if queries are taking too long, review your filters. If you have a lot of filters, check if a context filter would make more sense. If you have a dashboard that uses filters, consider using action filters, which can help with performance.
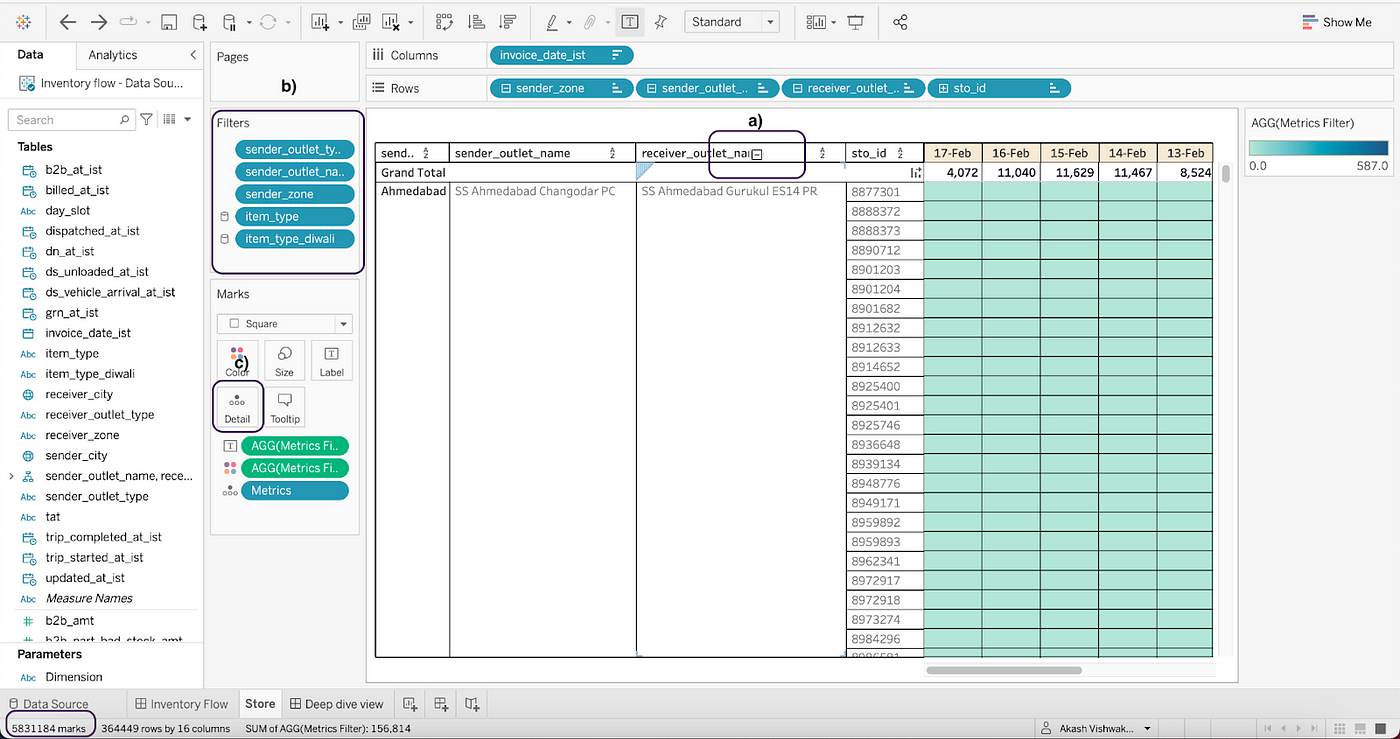
Always keep your marks lower
It is not advisable to keep large columns*rows (or marks) in the same view as it would lead to a rendering effect while loading the view.
Create hierarchies on dimensions and keep a summary view at default. Use +/- sign when need to expand/collapse, respectively.
Don’t force everything into a single view; instead, break them into multiple views and use filters.
Keep limited dimensions on details in the marks shelf.
Display data using charts/graphs — avoid tabular view. Aggregated charts are far easier to consume and help convey a story.
Fig. 3: Keeping your marks low in Tableau
Push complicated calculations to backend ETLs
We at Blinkit, maintain a layered architecture in our data warehouse. We have scheduled ETLs that power Tableau ingestion tables on an hourly or daily basis. We try to do most of the complex calculations within these ETLs and perform only non-additive/dynamic calculations on Tableau.
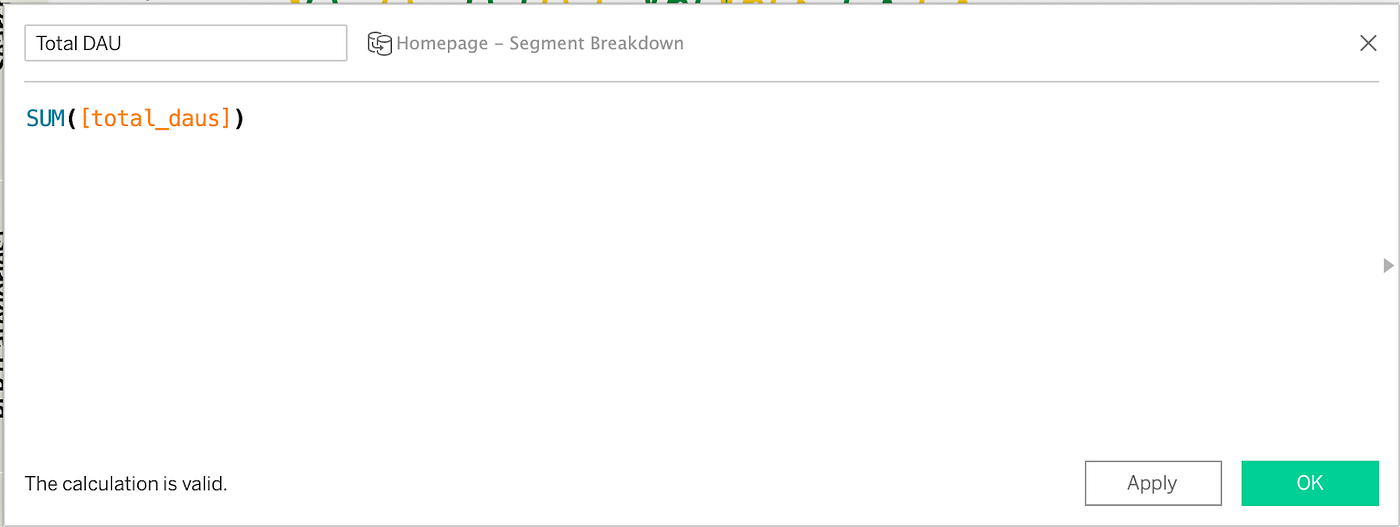
Wherever possible, aggregate all your rows in the backend itself. Tableau loves feeding aggregated calculations (as shown in Fig. 4). If required, use MIN or MAX over AVG.
Avoid using string calculations wherever possible. Datatypes in ascending order of computation time–Boolean<Int<Float<Date<DateTime<String.
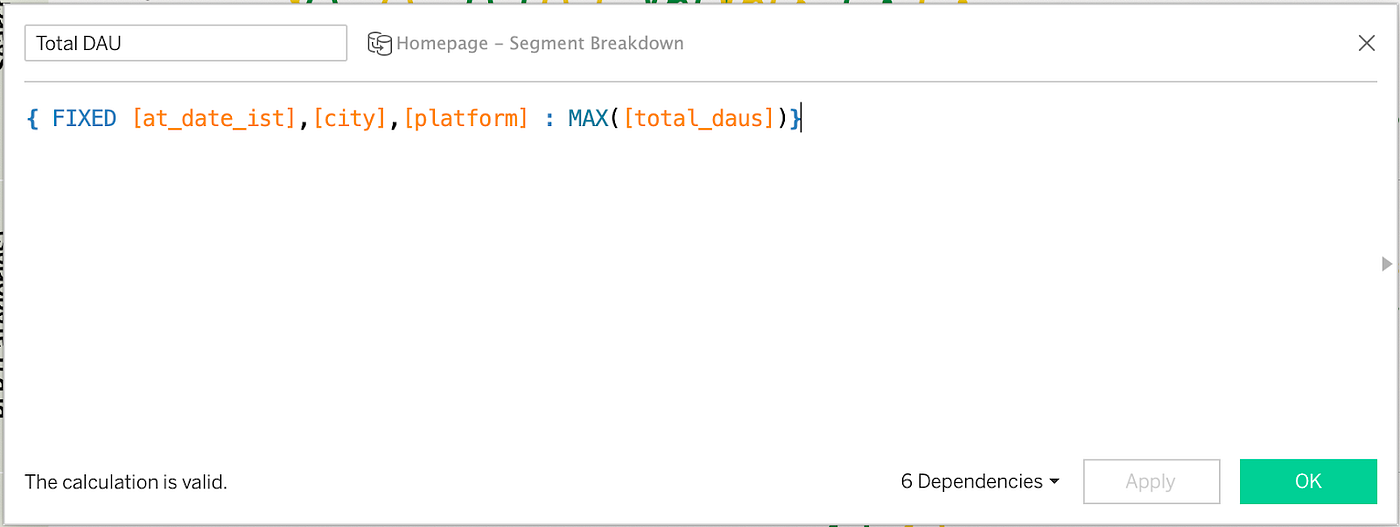
Avoid using table calculations and LOD (level of details) functions (Fig. 5).
Fig. 4: Pre-calculated fieldFig. 5: LOD functions that slow down Tableau
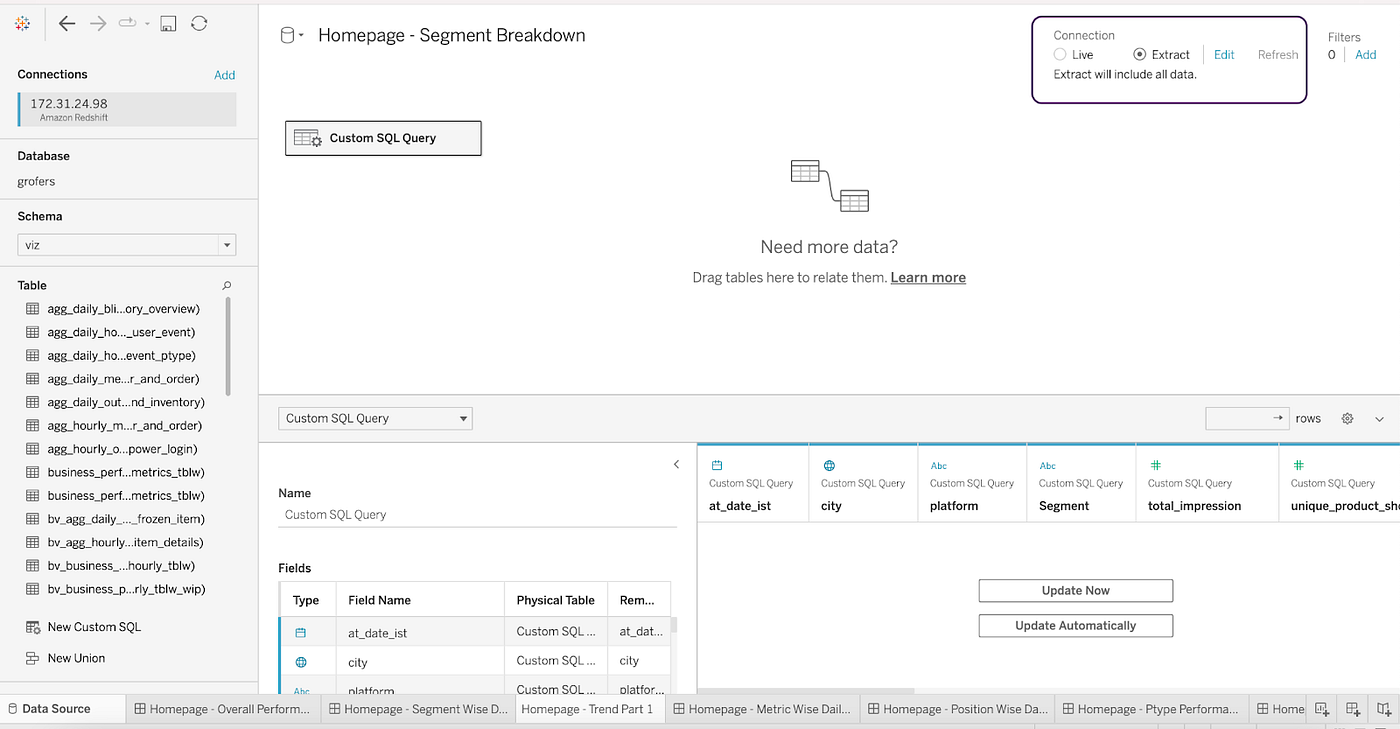
Use data extracts over live connection
Tableau allows two different connections, Live and Extract. While building views, always keep your data source connection as an extract; these are cached. Live connections are immense slow when working with huge data sets.
Fig. 6: Using Extracts in Tableau
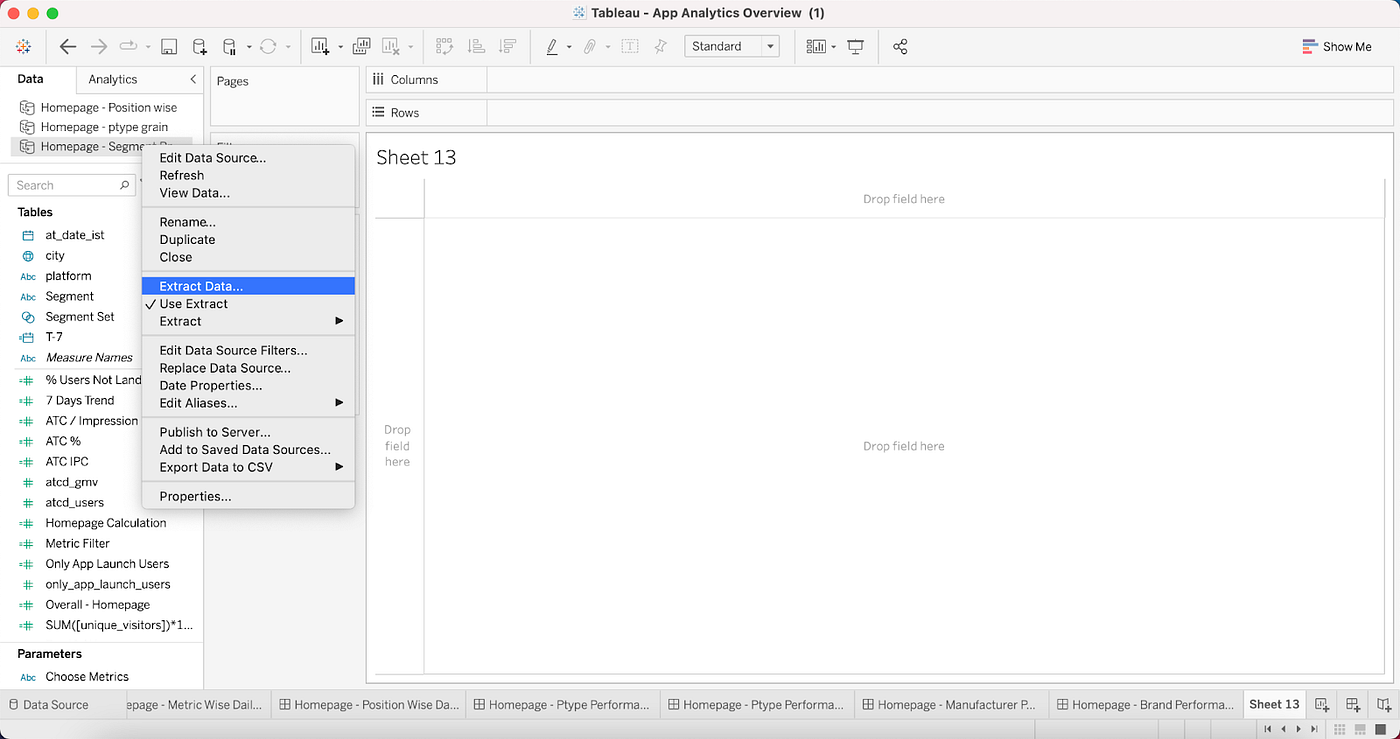
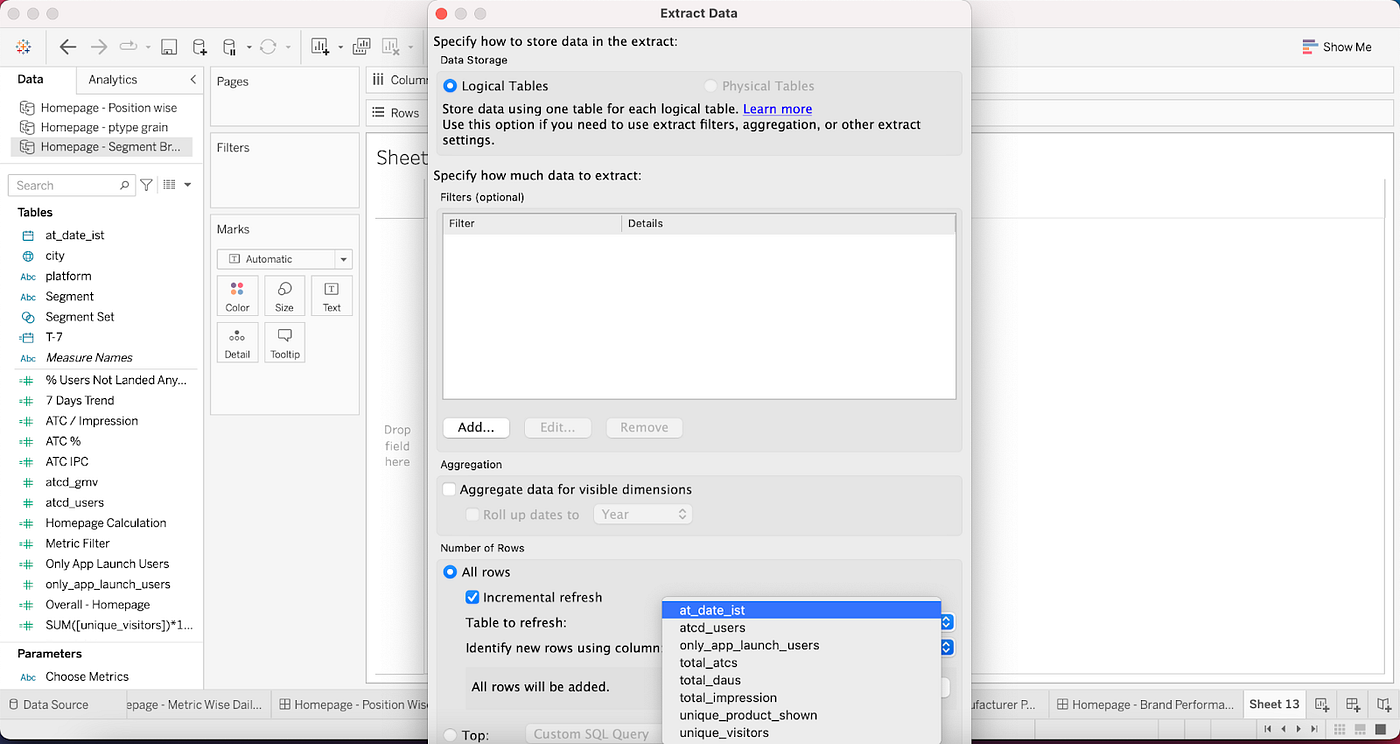
Incremental refresh over full refresh
Incremental refresh appends the record in a table based on the key chosen (such as at_date_ist in Fig. 8). Whenever the previous records don’t get updated, it's advisable to use an incremental refresh, which will decrease the refresh time of your workbook.
Fig. 7: Using Extract Data…Fig. 8: Enabling Incremental Refresh
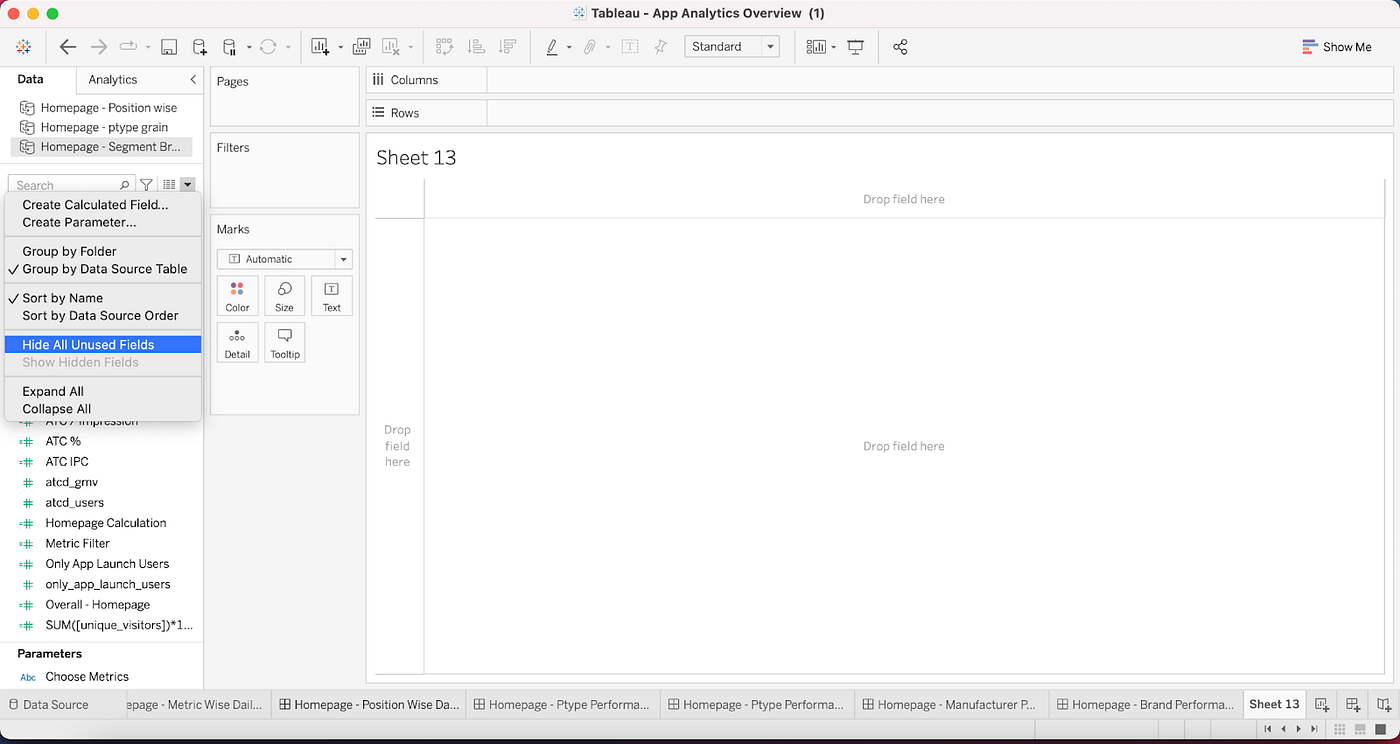
Hide all unused fields
Hide unused columns (measures/dimensions) in order to minimise extract refresh time or custom SQL query time.
Fig. 9: Hiding Unused fields
Conclusion
By following the best practices discussed above in this blog, you can create a fast and efficient dashboard that provides your users with valuable insights.
Akash is a Senior BI Engineer at Blinkit. Connect with him on LinkedIn.
In 1981, Xerox PARC introduced the first Graphical User Interface (GUI), marking a significant shift in computing. Over 43 years, rounded corners have evolved from a design embellishment to an industry standard in both software and hardware.
Setting up our printout delivery store has been extremely satisfying at many levels. At one end is the joy from customers discovering an easy, home-delivered solution for last-minute printouts.
Drishti Makhija works as a Software Developer Engineer (SDE) at Blinkit. She joined us about six months ago and is now a part of the tech team within the Product Listing and Search pod.